Thursday, March 31, 2016
Wednesday, March 30, 2016
USA and Others, 2011 per capita carbon emission
click here
http://cdiac.ornl.gov/trends/emis/top2011.cap
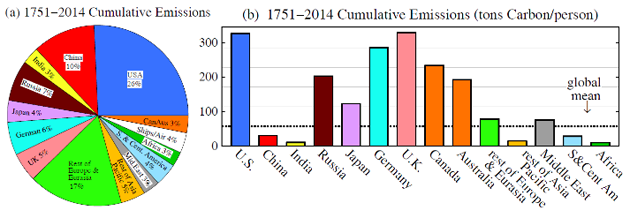
Ranking of the world's countries by 2011 per capita fossil-fuel CO2 emission rates.  National per capita estimates (CO2_CAP) are expressed in metric tons of carbon (not CO2).
===========================
Source: Tom Boden and Bob Andres
        Carbon Dioxide Information Analysis Center
        Oak Ridge National Laboratory

        Gregg Marland
        Research Institute for Environment, Energy and Economics Appalachian State University
=========================
USA,4.5;Russia,3.4;Japan,2.5;Germany,2.4;China,1.5;Indonesia,0.6;India,0.5;
Tuesday, March 29, 2016
Monday, March 28, 2016
methane emissions
Atmospheric methane, From Wikipedia, the free encyclopedia
https://en.wikipedia.org/wiki/Atmospheric_methane#Emissions_accounting_of_methane
"... it (methane) traps 29 times more heat per mass unit than carbon dioxide ... "
Mass (Tg/a) Type (%/a) Total (%/a)
Natural Emissions
Wetlands (incl. Rice agriculture) 225 83 37
Termites 20 7 3
Ocean 15 6 3
Hydrates 10 4 2
Natural Total 270 100 45
Anthropogenic Emissions
Energy 110 33 18
Landfills 40 12 7
Ruminants (Livestock) 115 35 19
Waste treatment 25 8 4
Biomass burning 40 12 7
Anthropogenic Total 330 100 55
Sinks
Soils -30 -5 -5
Tropospheric OH -510 -88 -85
Stratospheric loss -40 -7 -7
Sink Total -580 -100 -97
Emissions + Sinks
Imbalance (trend) +20 ~2.78 Tg/(nmol/mol) +7.19 (nmol/mol)/a
Sunday, March 27, 2016
Atmospheric Methane Forecast - Scary
Reference:
Atmospheric concentration of Methane
European Environment Agency (EEA)
Last modified 10 Mar 2016, 03:45 PM
http://www.eea.europa.eu/
data-and-maps/
figures/atmospheric-concentration-of-ch4-ppb-1
Saturday, March 26, 2016
Friday, March 25, 2016
Tuesday, March 22, 2016
livestocks long shadow
Table 3.1
Past and current concentration of important
greenhouse gases
Gas Pre-industrial Current Global
concentration tropospheric warming
(1 750) concentration potential*
Carbon dioxide (CO2) 277 ppm 382 ppm 1
Methane (CH4) 600 ppb 1 728 ppb 23
Nitrous oxide (N2O) 270–290 ppb 318 ppb 296
Note: ppm = parts per million; ppb = parts per billion; ppt
Livestock numbers (2002) and estimated carbon dioxide emissions from respiration
Species World total Biomass Carbon dioxide emissions
(million head) (million tonnes liveweight) (million tonnes CO2)
Cattle and buffaloes 1 496 501 1 906
Small ruminants 1 784 47.3 514
Camels 19 5.3 18
Horses 55 18.6 71
Pigs 933 92.8 590
Poultry1 17 437 33.0 61
Total2 699 3 161
Thursday, March 17, 2016
Tuesday, March 15, 2016
AMERICAN SPORTFISHING ASSOCIATION
AMERICAN SPORTFISHING ASSOCIATION
1001 North Fairfax Street, Suite 501, Alexandria VA 22314. www.ASAfishing.org.
http://asafishing.org/uploads/2011_ASASportfishing_in_America_Report_January_2013.pdf
http://asafishing.org/uploads/2011_ASASportfishing_in_America_Report_January_2013.pdf
Sunday, March 13, 2016


Monday, March 7, 2016
Enforce existing employment laws
Enforce existing employment laws
There is talk about building an expensive wall to control illegal immigration. It would be cheaper and faster to enforce existing employment laws. Assessing employers for back taxes with interest and penalties would finance the effort.
If our government is diligent about employment laws enforcement, it might discourage illegal immigration. It is worth a try. It would be more humane and efficient to focus on employers rather than immigrants. This is something we could implement quickly.
=======================
Steven A. Levy, Phone (781) 639-3553, cell: (781) 771-2779, 26 Sagamore Road, Marblehead, MA 01945
Sunday, March 6, 2016
Regional Climate Change and National Responsibilities 2016-03-06-HUFF
http://www.huffingtonpost.com/dr-james-hansen/regional-climate-change-a_b_9367312.html?utm_hp_ref=politics&ir=Politics
Global warming of about 1°F (0.6°C) over the past several decades now "loads the climate dice." Fig. 1 updates the "bell curve" analysis of our 2012 paper1 for Northern Hemisphere land, which showed that extreme hot summers now occur noticeably more often than they did 50 years ago. Our new paper2 shows that there are strong regional variations in this bell curve shift, and that the largest effects occur in nations least responsible for causing climate change.
GREENTV.com is an environmental website committed to aggregating, reporting, and creating top green stories across the web, as well as producing interviews
Regional Climate Change and National Responsibilities
Huffington Post 03/02/2016 11:43 am ET | Updated 4 days ago
Tuesday, March 1, 2016
Super Tuesday who is voting 11 states
Super Tuesday who is voting 11 states
25% of the population
Data is from Wikipedia
Alabama 4,833,722
Arkansas 2,959,373
Colorado 5,268,367
Georgia 9,992,167
Massachusetts 6,692,824
Minnesota 5,420,380
Oklahoma 3,850,568
Tennessee 6,495,978
Texas 26,448,193
Vermont 626,630
Virginia 8,260,405
Total 80,848,607
Tags: math, politics
For more information go to my blog at stevenlevymath.info
All videos at stevenlevymath.com
Email to stevenlevy781@gmail.com
Subscribe to:
Comments (Atom)