Showing posts with label climate change. Show all posts

Monday, March 28, 2016

methane emissions

Atmospheric methane, From Wikipedia, the free encyclopedia

https://en.wikipedia.org/wiki/Atmospheric_methane#Emissions_accounting_of_methane

"... it (methane) traps 29 times more heat per mass unit than carbon dioxide ... "


Mass (Tg/a) Type (%/a) Total (%/a)
Natural Emissions
Wetlands (incl. Rice agriculture) 225 83 37
Termites 20 7 3
Ocean 15 6 3
Hydrates 10 4 2
Natural Total 270 100 45


Anthropogenic Emissions

Energy 110 33 18
Landfills 40 12 7
Ruminants (Livestock) 115 35 19
Waste treatment 25 8 4
Biomass burning 40 12 7
Anthropogenic Total 330 100 55

Sinks
Soils -30 -5 -5
Tropospheric OH -510 -88 -85
Stratospheric loss -40 -7 -7
Sink Total -580 -100 -97
Emissions + Sinks
Imbalance (trend) +20 ~2.78 Tg/(nmol/mol) +7.19 (nmol/mol)/a
Sunday, March 6, 2016

Regional Climate Change and National Responsibilities 2016-03-06-HUFF

http://www.huffingtonpost.com/dr-james-hansen/regional-climate-change-a_b_9367312.html?utm_hp_ref=politics&ir=Politics

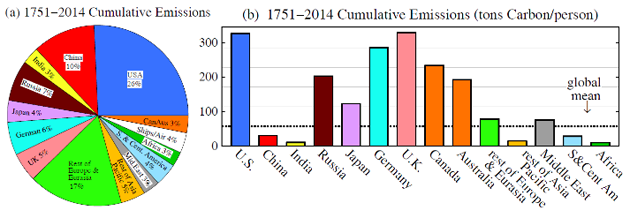
Global warming of about 1°F (0.6°C) over the past several decades now "loads the climate dice." Fig. 1 updates the "bell curve" analysis of our 2012 paper1 for Northern Hemisphere land, which showed that extreme hot summers now occur noticeably more often than they did 50 years ago. Our new paper2 shows that there are strong regional variations in this bell curve shift, and that the largest effects occur in nations least responsible for causing climate change.

GREENTV.com is an environmental website committed to aggregating, reporting, and creating top green stories across the web, as well as producing interviews

Regional Climate Change and National Responsibilities
Huffington Post  03/02/2016 11:43 am ET | Updated 4 days ago

2016-03-02-1456935900-6443111-ScreenShot20160302at11.23.39AM.png


Monday, February 29, 2016

stevenlevymath: Pie chart showing methane leaks


Click for video


By Glen Dillon - Own work, CC BY 3.0, https://commons.wikimedia.org/w/index.php?curid=4618400
An odourant injection station at MLV7 (main line valve) near Dampier, where Butanethiol is added to the natural gas inside the Dampier to Bunbury Natural Gas Pipeline

 Deepsea Delta oil drilling rig in the North Sea.
 GNU Free Documentation License
 Deepsea Delta oil drilling rig in the North Sea.

Photo: Erik Christensen


By Audriusa (Audrius Meskauskas) - Own work, CC BY-SA 3.0, https://commons.wikimedia
pipeline


Hi Steven,

It does appear this is an old fact sheet. The most up to date methane emission numbers can be found in this blog:

EPA Draft Says Oil & Gas Methane Emissions Are 27 Percent Higher than Earlier Estimates by David Lyons

Methane Leaks by Environmental Defense Fund

Reference: Methane leakage from natural gas operations

stevenlevymath: Pie chart showing methane leaks

Pie chart showing methane leaks. Data from the Environmental Defense Fund. http://www.edf.org/

Publication:  Methane leakage from natural gas operations

Tags: climate change, methane, pie chart, math, stevenlevymath


Thursday, February 4, 2016

Land Degradation from stevenlevymath

Tags: Math, science, climate change, graph, college, environment, videoscribe, animation

Narration: This is Steven Levy and this is stevenlevymath. This Video is about land degradation.

Narration: The data for this video came from the UN's report "Livestock's Long Shadow" unless stated other wise, 

Reference: "Livestock's Long Shadow" from the UN, page 29 to 30.

Reference:
Per wikipedia: total earth surface=510, water 361, land 149 in millions of sq. km.

Narration: According to Wikipedia, the Surface area of the earth: 510 million sq km. Water is 361 and land is 149 square km.

Narration: According to Wikipedia, arable land 19 million sq km, Pasture is 39, Forest is 48. And urban is 2 million sq km.

Reference, Wikipedia: Land: arable land is13% (19 km sq), pasture 26% (39), forest 32% (48), urban 1.5% (2).

Narration: 10.9 million sq km is degraded by water, 5.5 by wind, 2.4 by chemical, and 0.8 is physical.


Advanced Image Search: https://www.google.com/advanced_image_searchI used this site to find images in Creative Commons.

Here's how I attributed works:
NAME_OF_WORK=
AUTHOR_NAME=
AUTHOR_EMAIL=
URL_OF_WORK=
FILE_NAME=
UPLOAD_DATE=
LICENSE=under a Creative Commons Attribution 2.0. Full terms at http://creativecommons.org/licenses/by/2.0.

Photos I used:
===========
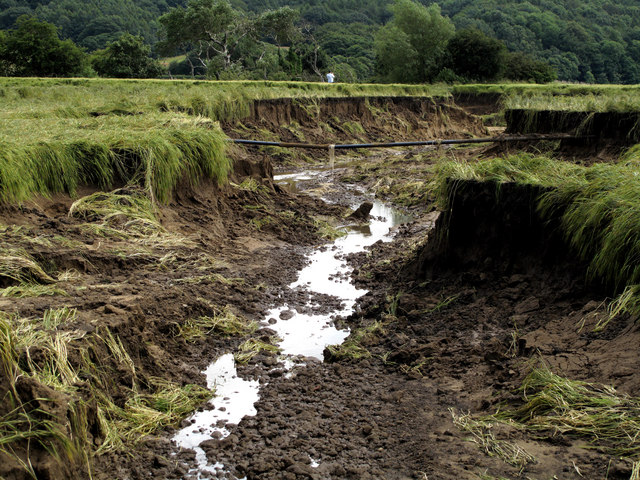
Houghall Farm - Severe & Catastrophic Erosion.
Narration: Water does the most damage.
Degraded by Water
NAME_OF_WORK=Houghall Farm, Severe & Catastrophic Erosion
AUTHOR_NAME=Trevor Littlewood
AUTHOR_EMAIL=http://www.geograph.org.uk/profile/39198
URL_OF_WORK=http://s0.geograph.org.uk/geophotos/01/41/56/1415690_9cd09683.jpg
LICENSE=under a Creative Commons Attribution 2.0.
Full terms at http://creativecommons.org/licenses/by/2.0.


File:Dust-storm-Texas-1935.png
Narration: Wind strips the topsoil.
Degraded by Wind
NAME_OF_WORK=Dust storm approaching Stratford, Texas. Dust Bowl surveying in Texas
AUTHOR_NAME=NOAA George E. Marsh Album
AUTHOR_EMAIL=coastsurveycommunications@noaa.gov
URL_OF_WORK=https://upload.wikimedia.org/wikipedia/commons/3/34/Dust-storm-Texas-1935.png
LICENSE=under a Creative Commons Attribution 2.0.
Full terms at http://creativecommons.org/licenses/by/2.0.


 Polluted stream.
Narration: Chemical pollution is expensive to repair.
Degraded by Chemicals
NAME_OF_WORK=red water pollution
AUTHOR_NAME=Auckland Council,Auckland,Australia
AUTHOR_EMAIL=http://aucklandcouncil.custhelp.com/app/ask
URL_OF_WORK=http://www.aucklandcouncil.govt.nz/EN/environmentwaste/pollution/Pages/home.aspx
LICENSE=under a Creative Commons Attribution 2.0.
Full terms at http://creativecommons.org/licenses/by/2.0.


Narration: Mining operations cause physical degradation.
Physical Degradation
Strip coal mining By Stephen Codrington, CC BY 2.5
NAME_OF_WORK=Strip coal mining
AUTHOR_NAME=Stephen Codrington
AUTHOR_EMAIL=
URL_OF_WORK=https://commons.wikimedia.org/w/index.php?curid=221253
FILE_NAME=Strip coal mining.jpg
UPLOAD_DATE=12 July 2005
LICENSE=under a Creative Commons Attribution 2.5. Full terms at http://creativecommons.org/licenses/by/2.5/


"Stop the Koch Brothers" by Free Press/ Free Press Action Fund licensed under CC 2.0

Thursday, January 28, 2016

Meat, Mortality and Livestock's Long Shadow from stevenlevymath.com

Meat, Mortality and Livestock's Long Shadow from stevenlevymath.com

This video compares data Japan and the USA in meat consumption and life expectancy.

Common Core Standard for Math:
Represent and interpret data. CCSS.MATH.CONTENT.3.MD.B.3
Draw a scaled picture graph and a scaled bar graph to represent ...

High School Social Studies: Public policy

Video Production Work Flow

  • Write narrative about every step
  • Get an idea
  • Research
  • Write story board
  • Write script
  • Start with titles in Adobe Premiere Elements (PE)
  • Create visuals with VideoScribe (VS) software
  • Export from VS. Import into PE. Narrate!
  • Fix with Audacity software (workflow)
  • Import into PE
  • Adjust timing
  • Upload to Teachertube, youtube and vimeo.
References:
  • Livestock's Long Shadow Livestock's Long Shadow, Ch. 1, Page 9
  • World Health Organization Data Global Health Observatory data repository (Use by theme, Mortality/morbidity. Each of these: [All NCDs, deaths per 100 000], [Cancer, deaths per 100 000], [Cardiovascular diseases, deaths per 100 000]. Use "filter table" option. Select "Japan" and "USA"
  • Data
Non Communicable Diseases, Data for 2000
Mortality per 100,000 population
Country--All NCD--Heart--Cancer
Japan----298------112----123
USA------477------202----140

Mortality in Japan and USA
NCD = Non Communicable Disease
Ref: WHO Global Health Observatory 

List of "Slides"
  • Japan vs. USA, Income and Meat consumption
  • Morbidity: Cardiovascular, cancer, and all non-communicable diseases
  • Discussion Questions
Discussion Questions
  • What are the implications for policy 
  • What additional research would be interesting?
Script
  • This is Steven Levy and this is Steven Levy Math. (Title Page)
  • This video compares meat consumption and mortality in Japan and the USA.
  • Japan and the United State have similar income levels. (Bar Graph). Page 9 in Livestock's Long Shadow 2006, shows per capita income in Japan and the USA as $27,000 and $36,000 per year respectively. These are figures for 2002.
  • Yet meat consumption in the United States is almost three times that of Japan. (Bar Graph) 42 vs. 125 kg per year.


Monday, November 9, 2015

The Money of Climate Change Denial

The Money of Climate Change Denial

According to Wikipedia under the heading "Climate Change Denial" between 2002 and 2010 $120 million was donated to "Donors Trust and Donors Capital Fund" that was distributed to the denial effort.

120 / 8 = $15 million per year.

Sunday, November 8, 2015

Graphic Illustrations for the UN Livestock's Long Shadow Report

stevenlevymath presents: Video Illustrations for the UN Livestock's Long Shadow Report. The videos are meant as a starting point in understanding the chapter.
FULL REPORT
http://www.fao.org/docrep/010/a0701e/a0701e00.HTM

Food and Agriculture Organization of the United Nations
http://www.fao.org/home/en/

Videos for:
=========================================
Title: stevenlevymath: UN "Livestock's Long Shadow", Executive Summary Illustrations
Description: Easy to understand pie charts, animated drawing
Tags: math, agriculture, climate change, livestock, methane, UN
Content Area : Mathematics | Subject : Grade 6 | Category : Ratios & Proportional Relationships | Skill : RP.6.3.c
=========================================
Production Notes:
Dec.24, 2015: Using Audacity I "fixed" the sound. Here are the steps: First "Noise Removal".
Apply "normalization."
"Equalization", AM Radio profile, use flatten
"Compression". Make softer louder. and Louder softer.
"Normalize again".
=====================================

Featured Post

Environmental Governor Needed!