Showing posts with label math. Show all posts

Tuesday, March 1, 2016

Super Tuesday who is voting 11 states

Super Tuesday  who is voting 11 states

25% of the population

Data is from Wikipedia
Alabama 4,833,722
 Arkansas 2,959,373
 Colorado 5,268,367
 Georgia 9,992,167
 Massachusetts 6,692,824
 Minnesota 5,420,380
 Oklahoma 3,850,568
 Tennessee 6,495,978
 Texas 26,448,193
 Vermont 626,630
 Virginia 8,260,405

Total 80,848,607

Tags: math, politics

For more information go to my blog at stevenlevymath.info
All videos at stevenlevymath.com
Email to stevenlevy781@gmail.com
Monday, February 29, 2016

stevenlevymath: Pie chart showing methane leaks


Click for video


By Glen Dillon - Own work, CC BY 3.0, https://commons.wikimedia.org/w/index.php?curid=4618400
An odourant injection station at MLV7 (main line valve) near Dampier, where Butanethiol is added to the natural gas inside the Dampier to Bunbury Natural Gas Pipeline

 Deepsea Delta oil drilling rig in the North Sea.
 GNU Free Documentation License
 Deepsea Delta oil drilling rig in the North Sea.

Photo: Erik Christensen


By Audriusa (Audrius Meskauskas) - Own work, CC BY-SA 3.0, https://commons.wikimedia
pipeline


Hi Steven,

It does appear this is an old fact sheet. The most up to date methane emission numbers can be found in this blog:

EPA Draft Says Oil & Gas Methane Emissions Are 27 Percent Higher than Earlier Estimates by David Lyons

Methane Leaks by Environmental Defense Fund

Reference: Methane leakage from natural gas operations

stevenlevymath: Pie chart showing methane leaks

Pie chart showing methane leaks. Data from the Environmental Defense Fund. http://www.edf.org/

Publication:  Methane leakage from natural gas operations

Tags: climate change, methane, pie chart, math, stevenlevymath


Friday, February 5, 2016

Animated Graph for Huffington Post - Toxic Loans by Peter Eavis, Feb. 5, 2016


Graph for Huffington Post - Toxic Loans by Peter Eavis, Feb. 5, 2016

China's total loans and financial assets = 30 T$
China's GDP = 10.9 Wikipedia (Historic GDP of China)

Analyst estimates 4.4 T$ potential losses, 6.6 T$ (non performing)

"Charlene Chu, an analyst in Hong Kong for Autonomous Research"

Tags: math, animation, graph, economics, geography, news

Thursday, February 4, 2016

Land Degradation from stevenlevymath

Tags: Math, science, climate change, graph, college, environment, videoscribe, animation

Narration: This is Steven Levy and this is stevenlevymath. This Video is about land degradation.

Narration: The data for this video came from the UN's report "Livestock's Long Shadow" unless stated other wise, 

Reference: "Livestock's Long Shadow" from the UN, page 29 to 30.

Reference:
Per wikipedia: total earth surface=510, water 361, land 149 in millions of sq. km.

Narration: According to Wikipedia, the Surface area of the earth: 510 million sq km. Water is 361 and land is 149 square km.

Narration: According to Wikipedia, arable land 19 million sq km, Pasture is 39, Forest is 48. And urban is 2 million sq km.

Reference, Wikipedia: Land: arable land is13% (19 km sq), pasture 26% (39), forest 32% (48), urban 1.5% (2).

Narration: 10.9 million sq km is degraded by water, 5.5 by wind, 2.4 by chemical, and 0.8 is physical.


Advanced Image Search: https://www.google.com/advanced_image_searchI used this site to find images in Creative Commons.

Here's how I attributed works:
NAME_OF_WORK=
AUTHOR_NAME=
AUTHOR_EMAIL=
URL_OF_WORK=
FILE_NAME=
UPLOAD_DATE=
LICENSE=under a Creative Commons Attribution 2.0. Full terms at http://creativecommons.org/licenses/by/2.0.

Photos I used:
===========
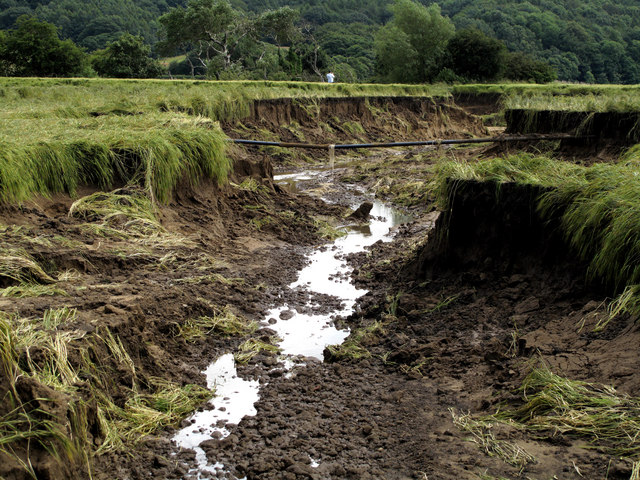
Houghall Farm - Severe & Catastrophic Erosion.
Narration: Water does the most damage.
Degraded by Water
NAME_OF_WORK=Houghall Farm, Severe & Catastrophic Erosion
AUTHOR_NAME=Trevor Littlewood
AUTHOR_EMAIL=http://www.geograph.org.uk/profile/39198
URL_OF_WORK=http://s0.geograph.org.uk/geophotos/01/41/56/1415690_9cd09683.jpg
LICENSE=under a Creative Commons Attribution 2.0.
Full terms at http://creativecommons.org/licenses/by/2.0.


File:Dust-storm-Texas-1935.png
Narration: Wind strips the topsoil.
Degraded by Wind
NAME_OF_WORK=Dust storm approaching Stratford, Texas. Dust Bowl surveying in Texas
AUTHOR_NAME=NOAA George E. Marsh Album
AUTHOR_EMAIL=coastsurveycommunications@noaa.gov
URL_OF_WORK=https://upload.wikimedia.org/wikipedia/commons/3/34/Dust-storm-Texas-1935.png
LICENSE=under a Creative Commons Attribution 2.0.
Full terms at http://creativecommons.org/licenses/by/2.0.


 Polluted stream.
Narration: Chemical pollution is expensive to repair.
Degraded by Chemicals
NAME_OF_WORK=red water pollution
AUTHOR_NAME=Auckland Council,Auckland,Australia
AUTHOR_EMAIL=http://aucklandcouncil.custhelp.com/app/ask
URL_OF_WORK=http://www.aucklandcouncil.govt.nz/EN/environmentwaste/pollution/Pages/home.aspx
LICENSE=under a Creative Commons Attribution 2.0.
Full terms at http://creativecommons.org/licenses/by/2.0.


Narration: Mining operations cause physical degradation.
Physical Degradation
Strip coal mining By Stephen Codrington, CC BY 2.5
NAME_OF_WORK=Strip coal mining
AUTHOR_NAME=Stephen Codrington
AUTHOR_EMAIL=
URL_OF_WORK=https://commons.wikimedia.org/w/index.php?curid=221253
FILE_NAME=Strip coal mining.jpg
UPLOAD_DATE=12 July 2005
LICENSE=under a Creative Commons Attribution 2.5. Full terms at http://creativecommons.org/licenses/by/2.5/


"Stop the Koch Brothers" by Free Press/ Free Press Action Fund licensed under CC 2.0

Tuesday, February 2, 2016

Problem Solving

Three Problems with Math:
(1) answering the wrong question (2) Mistakes in computation (3) Learning the wrong  methods

Students have one to two minutes to solve problems. Most math courses have about 15 types of problems.

Here's my advice:
(1) Read "Problem Solving Strategies" by Herr and Johnson.
(2) Thoroughly learn each type of problem and all its variations. Have at least two ways to solve each problem. learn how to estimate the answer.

During the test:
(1) Read each problem at least three times. More if you are an ESL student.
(2) Classify the problem by the types you have learned.
(3) Make a guess.
(4) Make an estimate.
(5) Solve the problem
(6) Does the answer agree with your guess and estimate? If not fix.

Memorizing procedures sometimes called "steps" is a loosing battle. The older we get the harder it is to memorize unrelated facts. Younger students might be able to do it, but High School and Adult learners could have problems with memorizing.


Thursday, January 28, 2016

Meat, Mortality and Livestock's Long Shadow from stevenlevymath.com

Meat, Mortality and Livestock's Long Shadow from stevenlevymath.com

This video compares data Japan and the USA in meat consumption and life expectancy.

Common Core Standard for Math:
Represent and interpret data. CCSS.MATH.CONTENT.3.MD.B.3
Draw a scaled picture graph and a scaled bar graph to represent ...

High School Social Studies: Public policy

Video Production Work Flow

  • Write narrative about every step
  • Get an idea
  • Research
  • Write story board
  • Write script
  • Start with titles in Adobe Premiere Elements (PE)
  • Create visuals with VideoScribe (VS) software
  • Export from VS. Import into PE. Narrate!
  • Fix with Audacity software (workflow)
  • Import into PE
  • Adjust timing
  • Upload to Teachertube, youtube and vimeo.
References:
  • Livestock's Long Shadow Livestock's Long Shadow, Ch. 1, Page 9
  • World Health Organization Data Global Health Observatory data repository (Use by theme, Mortality/morbidity. Each of these: [All NCDs, deaths per 100 000], [Cancer, deaths per 100 000], [Cardiovascular diseases, deaths per 100 000]. Use "filter table" option. Select "Japan" and "USA"
  • Data
Non Communicable Diseases, Data for 2000
Mortality per 100,000 population
Country--All NCD--Heart--Cancer
Japan----298------112----123
USA------477------202----140

Mortality in Japan and USA
NCD = Non Communicable Disease
Ref: WHO Global Health Observatory 

List of "Slides"
  • Japan vs. USA, Income and Meat consumption
  • Morbidity: Cardiovascular, cancer, and all non-communicable diseases
  • Discussion Questions
Discussion Questions
  • What are the implications for policy 
  • What additional research would be interesting?
Script
  • This is Steven Levy and this is Steven Levy Math. (Title Page)
  • This video compares meat consumption and mortality in Japan and the USA.
  • Japan and the United State have similar income levels. (Bar Graph). Page 9 in Livestock's Long Shadow 2006, shows per capita income in Japan and the USA as $27,000 and $36,000 per year respectively. These are figures for 2002.
  • Yet meat consumption in the United States is almost three times that of Japan. (Bar Graph) 42 vs. 125 kg per year.


Monday, January 4, 2016

Steven Levy Math, "Livestock's Long Shadow" Chapter 1, Page 5 Lesson Plan for High School

Description: This lesson shows how to use a polynomial to make a forecast.
(1) Students can make a graph from the data provided
(2)  Students can hand draw the forecast to the year 2100
(3) Using the polynomial students can calculate CO2 ppm for the year 2100.

This lesson shows how math could be used to make forecasts. I will post a video to go with this lesson.


Monday, December 7, 2015

Dividing by Fractions, An Animation, Partition Division

click here

Description:

I added captions!

The video is an animated explanation of dividing by fractions.  This article was the inspiration: Making Sense of Partitive and Quotitive Division: A Snapshot of Teachers’ Pedagogical Content Knowledge by Anne Roche, Australian Catholic University,  and Doug Clarke, Australian Catholic University, . Teachers and students understand 8 / 2. But 8 / (.5) can be more difficult.

The process of dividing 8 by 2 is partition division. Dividing 8 by 0.5 is best done with partition division.
Tags : math, fractions, third grade, GED, stevenlevymath


Wednesday, November 25, 2015

Stevenlevymath: Funny Skit About Fractions


The beginning of a funny skit about fractions auditioning for a movie. Students could have fun writing the rest of it.

Click Here

Thursday, November 12, 2015

Lesson Plan For Grade 3, Quotition Division Research

Understanding quotition division is a prerequisite to making progress in problem solving and algebra. Students who do not have an intuitive feel for quotition must rely on processes. When they get to word problems, they ask "how do I set up the problem"? As students age their memory for unrelated processes gets weaker.


This is a bibliography for "Lesson Plan For Grade 3, Quotition Division"


Making Sense of Partitive and Quotitive Division
about 25% of teachers could make sense of 8 / (1/2) or 8/0.5.

IGPME - The International Group for the Psychology of Mathematics Education - Home

Wednesday, November 11, 2015

from stevenlevymath A Math Reference

Stevenlevymath Presents Division


===============
Here's  the script:
===============
tags: math, division, arithmetic, stevenlevymath

Steven Levy Math Presents

What is division?
Reference 
Wikipedia  and Mathematics Stack Exchange


Division can written as: a/b = c.
a is the dividend.
b is the divisor.
c is the quotient.

Division can be expressed as:
1) Partition division
2) Quotition division


Partition Division

6 / 2 = ?
Divide 6 into 2 groups.
How many are in each group?

(Get the answer! Show 6 tiles. Make 2 equal groups. Count how many there are in a group.)

6/2 = 3

Quotition Division

6/2 = ?

Divide 6 into groups of 2.
How many groups are there?

(Get the answer! Show 6 tiles. Make groups of 2 tiles. Count how many groups.)

6/2 = 3


My Sites

Video: stevenlevymath.com
Blog: stevenlevymath.info


The End


http://math.stackexchange.com/questions/638716/quotition-versus-partition


Monday, November 9, 2015

The Money of Climate Change Denial

The Money of Climate Change Denial

According to Wikipedia under the heading "Climate Change Denial" between 2002 and 2010 $120 million was donated to "Donors Trust and Donors Capital Fund" that was distributed to the denial effort.

120 / 8 = $15 million per year.

Sunday, November 8, 2015

Math in the News

Huffington Post:  "Women make 74 cents to a man's dollar in the U.S., according to a report out this week from PayScale. "


Friday, August 22, 2014

math sites and to do list

terc.edu
comap.com

website to do list: download widget for stats, ad blocker, work on standard page, links
make more pages.

Every lesson needs a TT, YT and local source

Featured Post

Environmental Governor Needed!