Friday, March 31, 2017

Carbon Tax Reference

I spoke with Cindy Luppi; she is ready and eager to meet with us in person or by phone so as to prep and answer questions. She points out that Massachusetts sends $20 Billion out of state each year for our energy needs. Shouldn't we discourage these payments and work on home grown energy sources?

The bills:
There are two bills that have been filed:  In the Senate SD 1021. In the house House HD 1504. They​ both  put a gradually rising fee on fossil fuels from all sectors (except the major electricity producers which fall under the Regional Greenhouse Gas Initiative (RGGI)).  Monies are returned to households and businesses to protect them from price increases. Both bills make a special effort to protect low income households that are most vulnerable to price changes. The bill sponsors are Sen. Michael Barrett of Lexington and Rep. Jen Benson of Lunenburg​. They differ somewhat: The Senate bill is a  neutral simple fee - everyone gets a check in the mail! -  and appeals to conservatives (is more likely to pass?). The House bill returns 80% of the money collected but uses 20% for  (not clear on details here)

Look for this:
On april 27, the Boston Foundation has paid for a study and will issue that study showing the benefits of carbon pricing in terms of smog reduction; it will estimate the health benefits of carbon pricing.

Reaching out to Lynners: Let's write a note to Lynners we know, acquainting them with carbon pricing and the bills and urging them to add to our numbers. David suggested to Jeff Barz Snell that he come as a man of the cloth, wondering whether we can reach out to ECCO people or Neighbor to Neighbor people.

Cindy Luppi logistics:
 I hate to have her schlep up here although she is willing. She will be at SSU giving a talk at 12:30 on Monday April 10 in the MLK room of the Ellison Center. What is your preference? Should we schedule a phone chat?

PS Judith will be doing a session at SSC Earth Days on Friday April 14 also in the  MLK room of the Ellison Center. (SSU has a week of earthdays with movies and panel discussions. )

Tuesday, March 21, 2017

Carbon Dioxide 170321

Carbon Dioxide forecast. 170321

Vimeo: https://vimeo.com/stevenlevymath
Teachertube: stevenlevymath.com
Facebook: https://www.facebook.com/stevenlevymath

Reference: Data from Earth Systems Research Laboratory
https://www.esrl.noaa.gov/gmd/ccgg/trends/data.html

ftp://aftp.cmdl.noaa.gov/products/trends/co2/co2_annmean_mlo.txt
 See www.esrl.noaa.gov/gmd/ccgg/trends/ for additional details.
#
# Data from March 1958 through April 1974 have been obtained by C. David Keeling
# of the Scripps Institution of Oceanography (SIO) and were obtained from the
# Scripps website (scrippsco2.ucsd.edu).
#
# The estimated uncertainty in the annual mean is the standard deviation
# of the differences of annual mean values determined independently by
# NOAA/ESRL and the Scripps Institution of Oceanography.
#
# NOTE: In general, the data presented for the last year are subject to change,
# depending on recalibration of the reference gas mixtures used, and other quality
# control procedures. Occasionally, earlier years may also be changed for the same
# reasons.  Usually these changes are minor.
#
# CO2 expressed as a mole fraction in dry air, micromol/mol, abbreviated as ppm
#
# year     mean      unc
  1959   315.97     0.12
  1960   316.91     0.12
  1961   317.64     0.12
  1962   318.45     0.12
  1963   318.99     0.12
  1964   319.62     0.12
  1965   320.04     0.12
  1966   321.38     0.12
  1967   322.16     0.12
  1968   323.04     0.12
  1969   324.62     0.12
  1970   325.68     0.12
  1971   326.32     0.12
  1972   327.45     0.12
  1973   329.68     0.12
  1974   330.18     0.12
  1975   331.11     0.12
  1976   332.04     0.12
  1977   333.83     0.12
  1978   335.40     0.12
  1979   336.84     0.12
  1980   338.75     0.12
  1981   340.11     0.12
  1982   341.45     0.12
  1983   343.05     0.12
  1984   344.65     0.12
  1985   346.12     0.12
  1986   347.42     0.12
  1987   349.19     0.12
  1988   351.57     0.12
  1989   353.12     0.12
  1990   354.39     0.12
  1991   355.61     0.12
  1992   356.45     0.12
  1993   357.10     0.12
  1994   358.83     0.12
  1995   360.82     0.12
  1996   362.61     0.12
  1997   363.73     0.12
  1998   366.70     0.12
  1999   368.38     0.12
  2000   369.55     0.12
  2001   371.14     0.12
  2002   373.28     0.12
  2003   375.80     0.12
  2004   377.52     0.12
  2005   379.80     0.12
  2006   381.90     0.12
  2007   383.79     0.12
  2008   385.60     0.12
  2009   387.43     0.12
  2010   389.90     0.12
  2011   391.65     0.12
  2012   393.85     0.12
  2013   396.52     0.12
  2014   398.65     0.12
  2015   400.83     0.12
  2016   404.21     0.12

Friday, March 17, 2017

Medication Adherence: A Call for Action

Medication Adherence: A Call for Action

US National Library of Medicine National Institutes of Health
www.ncbi.nlm.nih.gov/pmc/articles/PMC3947508/

. Author manuscript; available in PMC 2014 Mar 9.
Published in final edited form as:
Am Heart J. 2011 Sep; 162(3): 412–424.doi:  10.1016/j.ahj.2011.06.007

  • Half of the 3.2 billion annual prescriptions dispensed in the United States are not taken as prescribed.
  • Cost is 100-300 billion dollars
  • cost estimates for non-adherence range from $100-300 billion each year, and include both direct and indirect costs.
  • total medical is 3 trillion dollars
  • 17% gnp
  • 83 other
  • 14.6 T$ other, 3T$ Health care


Wednesday, March 15, 2017

Sea Temperature & CO2 Levels

"Figure 1. Average Global Sea Surface Temperature, 1880-2015",,,
Source: EPA's Climate Change Indicators in the United States: www.epa.gov/climate-indicators,,,
"Data source: NOAA, 2016",,,
Web update: August 2016,,,
Units: temperature anomaly (°F),,,
,,,


Year,Annual anomaly,Lower 95% confidence interval,Upper 95% confidence interval
1880,-0.4700088,-0.672646261,-0.267371339
1881,-0.3568788,-0.560588343,-0.153169257
1882,-0.3726612,-0.575728173,-0.169594227
1883,-0.448443,-0.650803864,-0.246082136
1884,-0.5897538,-0.790478088,-0.389029512
1885,-0.6636546,-0.86307244,-0.46423676
1886,-0.6439392,-0.842606641,-0.445271759
1887,-0.7616232,-0.959851596,-0.563394804
1888,-0.5166342,-0.713950039,-0.319318361
1889,-0.4717926,-0.674798269,-0.268786931
1890,-0.8875836,-1.093269328,-0.681897872
1891,-0.6603264,-0.864035943,-0.456616857
1892,-0.8173098,-1.021385617,-0.613233983
1893,-0.8148276,-1.019876951,-0.609778249
1894,-0.84978,-1.054495221,-0.645064779
1895,-0.6772536,-0.884986602,-0.469520598
1896,-0.4412844,-0.658507231,-0.224061569
1897,-0.4894326,-0.72538697,-0.25347823
1898,-0.78255,-1.01178857,-0.55331143
1899,-0.578736,-0.812490961,-0.344981039
1900,-0.4833054,-0.715645027,-0.250965773
1901,-0.6831072,-0.917128245,-0.449086155
1902,-0.7883226,-1.014939966,-0.561705234
1903,-0.9732618,-1.201684475,-0.744839125
1904,-1.123038,-1.35535084,-0.89072516
1905,-0.8347986,-1.077359825,-0.592237375
1906,-0.795843,-1.046455195,-0.545230805
1907,-0.917685,-1.193929878,-0.641440122
1908,-1.160703,-1.448467581,-0.872938419
1909,-1.189773,-1.462982377,-0.916563623
1910,-1.112769,-1.375006453,-0.850531547
1911,-1.1706066,-1.430986385,-0.910226815
1912,-0.8718498,-1.130527033,-0.613172567
1913,-0.9557658,-1.205831077,-0.705700523
1914,-0.6931926,-0.935060094,-0.451325106
1915,-0.5274864,-0.773385722,-0.281587078
1916,-0.8644752,-1.117509302,-0.611441098
1917,-0.7996338,-1.058479388,-0.540788212
1918,-0.6306858,-0.89171012,-0.36966148
1919,-0.6633414,-0.929067962,-0.397614838
1920,-0.7196544,-0.993296233,-0.446012567
1921,-0.7222464,-1.004993095,-0.439499705
1922,-0.8093034,-1.099308434,-0.519298366
1923,-0.7910208,-1.094900201,-0.487141399
1924,-0.8465382,-1.160946149,-0.532130251
1925,-0.6946722,-1.021483848,-0.367860552
1926,-0.554238,-0.891305121,-0.217170879
1927,-0.6640884,-1.011538192,-0.316638608
1928,-0.7589772,-1.11605542,-0.40189898
1929,-0.8502282,-1.216749877,-0.483706523
1930,-0.5835816,-0.955162244,-0.212000956
1931,-0.5537106,-0.932835199,-0.174586001
1932,-0.683568,-1.06960601,-0.29752999
1933,-0.7777674,-1.165109025,-0.390425775
1934,-0.6447312,-1.036132551,-0.253329849
1935,-0.6452784,-1.032700351,-0.257856449
1936,-0.5988258,-0.978557274,-0.219094326
1937,-0.4155462,-0.79004635,-0.04104605
1938,-0.5834772,-0.944283123,-0.222671277
1939,-0.4924098,-0.866594077,-0.118225523
1940,-0.1797678,-0.611756958,0.252221358
1941,0.0471582,-0.424552683,0.518869083
1942,-0.0406296,-0.527506382,0.446247182
1943,-0.039807,-0.528775582,0.449161582
1944,0.2180826,-0.249640262,0.685805462
1945,0.157752,-0.301294896,0.616798896
1946,-0.3853548,-0.810914088,0.040204488
1947,-0.5579568,-0.948546395,-0.167367205
1948,-0.5477346,-0.927875577,-0.167593623
1949,-0.4941792,-0.871493811,-0.116864589
1950,-0.5531796,-0.951249954,-0.155109246
1951,-0.368496,-0.78529303,0.04830103
1952,-0.2612952,-0.649150626,0.126560226
1953,-0.2661372,-0.619589277,0.087314877
1954,-0.5613282,-0.911880762,-0.210775638
1955,-0.632412,-0.970879428,-0.293944572
1956,-0.5871312,-0.915671168,-0.258591232
1957,-0.2226618,-0.551012288,0.105688688
1958,-0.1943208,-0.516973712,0.128332112
1959,-0.2735424,-0.593716904,0.046632104
1960,-0.3035772,-0.615061841,0.007907441
1961,-0.2642508,-0.565538695,0.037037095
1962,-0.2717028,-0.567634502,0.024228902
1963,-0.260397,-0.544855332,0.024061332
1964,-0.5913306,-0.867462813,-0.315198387
1965,-0.489249,-0.758095563,-0.220402437
1966,-0.39411,-0.655038934,-0.133181066
1967,-0.4203576,-0.672233081,-0.168482119
1968,-0.38187,-0.626907316,-0.136832684
1969,-0.0876366,-0.323274253,0.148001053
1970,-0.3086334,-0.543318336,-0.073948464
1971,-0.5571756,-0.780473197,-0.333878003
1972,-0.2051676,-0.424868825,0.014533625
1973,-0.1836738,-0.397605623,0.030258023
1974,-0.4251924,-0.629085162,-0.221299638
1975,-0.4675428,-0.66938017,-0.26570543
1976,-0.4096278,-0.611403493,-0.207852107
1977,-0.0397692,-0.227019275,0.147480875
1978,-0.165393,-0.356035622,0.025249622
1979,0.0692586,-0.122263389,0.260780589
1980,0.0771966,-0.122751069,0.277144269
1981,0.0219924,-0.186189496,0.230174296
1982,-0.0032202,-0.220986697,0.214546297
1983,0.1239354,-0.099306449,0.347177249
1984,-0.0596304,-0.291030626,0.171769826
1985,-0.109917,-0.340859567,0.121025567
1986,-0.0137916,-0.243491224,0.215908024
1987,0.2456388,0.01795293,0.47332467
1988,0.1634436,-0.062706429,0.389593629
1989,0.0785898,-0.144874957,0.302054557
1990,0.274842,0.05989442,0.48978958
1991,0.2497932,0.036969689,0.462616711
1992,0.0669942,-0.146004691,0.279993091
1993,0.0748224,-0.13980646,0.28945126
1994,0.1436454,-0.072629921,0.359920721
1995,0.2219328,0.004337841,0.439527759
1996,0.1661922,-0.052941761,0.385326161
1997,0.428193,0.206967426,0.649418574
1998,0.5327244,0.305585853,0.759862947
1999,0.1698606,-0.065274711,0.404995911
2000,0.2325024,-0.006856215,0.471861015
2001,0.4042188,0.157914871,0.650522729
2002,0.4671414,0.214033523,0.720249277
2003,0.5250798,0.265489953,0.784669647
2004,0.4946364,0.228324975,0.760947825
2005,0.5327874,0.259646368,0.805928432
2006,0.5114556,0.22994419,0.79296701
2007,0.3846042,0.097445805,0.671762595
2008,0.3673116,0.081478274,0.653144926
2009,0.5894424,0.295896687,0.882988113
2010,0.6127182,0.317987636,0.907448764
2011,0.4286736,0.13328918,0.72405802
2012,0.528696,0.232869466,0.824522534
2013,0.5846742,0.28922658,0.88012182
2014,0.7512552,0.45580758,1.04670282
2015,0.935577,0.64012938,1.23102462

climate.nasa.gov/climate_resources/24/


===== extra data ==========

ftp://aftp.cmdl.noaa.gov/products/trends/co2/co2_annmean_mlo.txt
 See www.esrl.noaa.gov/gmd/ccgg/trends/ for additional details.
#  
# Data from March 1958 through April 1974 have been obtained by C. David Keeling
# of the Scripps Institution of Oceanography (SIO) and were obtained from the
# Scripps website (scrippsco2.ucsd.edu).
#
# The estimated uncertainty in the annual mean is the standard deviation
# of the differences of annual mean values determined independently by
# NOAA/ESRL and the Scripps Institution of Oceanography.
#
# NOTE: In general, the data presented for the last year are subject to change, 
# depending on recalibration of the reference gas mixtures used, and other quality
# control procedures. Occasionally, earlier years may also be changed for the same
# reasons.  Usually these changes are minor.
#
# CO2 expressed as a mole fraction in dry air, micromol/mol, abbreviated as ppm
#
# year     mean      unc
  1959   315.97     0.12
  1960   316.91     0.12
  1961   317.64     0.12
  1962   318.45     0.12
  1963   318.99     0.12
  1964   319.62     0.12
  1965   320.04     0.12
  1966   321.38     0.12
  1967   322.16     0.12
  1968   323.04     0.12
  1969   324.62     0.12
  1970   325.68     0.12
  1971   326.32     0.12
  1972   327.45     0.12
  1973   329.68     0.12
  1974   330.18     0.12
  1975   331.11     0.12
  1976   332.04     0.12
  1977   333.83     0.12
  1978   335.40     0.12
  1979   336.84     0.12
  1980   338.75     0.12
  1981   340.11     0.12
  1982   341.45     0.12
  1983   343.05     0.12
  1984   344.65     0.12
  1985   346.12     0.12
  1986   347.42     0.12
  1987   349.19     0.12
  1988   351.57     0.12
  1989   353.12     0.12
  1990   354.39     0.12
  1991   355.61     0.12
  1992   356.45     0.12
  1993   357.10     0.12
  1994   358.83     0.12
  1995   360.82     0.12
  1996   362.61     0.12
  1997   363.73     0.12
  1998   366.70     0.12
  1999   368.38     0.12
  2000   369.55     0.12
  2001   371.14     0.12
  2002   373.28     0.12
  2003   375.80     0.12
  2004   377.52     0.12
  2005   379.80     0.12
  2006   381.90     0.12
  2007   383.79     0.12
  2008   385.60     0.12
  2009   387.43     0.12
  2010   389.90     0.12
  2011   391.65     0.12
  2012   393.85     0.12
  2013   396.52     0.12
  2014   398.65     0.12
  2015   400.83     0.12
  2016   404.21     0.12

USA vs Mexico Demographics

Reference:

www.cia.gov/library/publications/the-world-factbook/geos/mx.html


USA
0-14 years: 18.84% (male 31,182,660/female 29,854,687)
15-24 years: 13.46% (male 22,360,342/female 21,252,215)
25-54 years: 39.6% (male 64,170,791/female 64,135,619)
55-64 years: 12.85% (male 20,081,837/female 21,536,994)
65 years and over: 15.25% (male 21,895,128/female 27,525,255) (2016 est.)


Mexico
0-14 years: 27.26% (male 17,167,636/female 16,402,301)
15-24 years: 17.72% (male 11,049,818/female 10,770,843)
25-54 years: 40.69% (male 24,174,900/female 25,938,909)
55-64 years: 7.41% (male 4,187,644/female 4,944,802)

65 years and over: 6.93% (male 3,827,870/female 4,702,026) (2016 est.)

Friday Coffee March 17, 2017

Friday Coffee March 17, 2017, Explorers LLI

The 1/12 Virus Invades Fraction Land

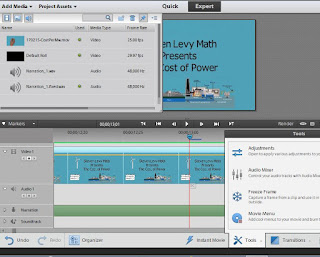
DragonFrame (stop motion), Adobe Premiere Elements, Narration, Background Music and Foley (noises).


Tuesday, March 14, 2017

Steven Levy Math Work Flow

Research (Wikipedia)


Create animation with VideoScribe

Edit in Adobe Premiere Elements

Edit Sound In Audacity

Finish with Adobe Premiere Elements


Steven Levy Math Business Rules

Mission (Numbers Behind the News)
  • Short videos that help people understand basic math. 
  • Use math to understand the numbers behind science, economics and public policy
  • Reference reliable sources
What is a reliable source?
  • Who funded or influenced their work?
  • Peer review?
  • Focus
  • No absolute truth

“An expert is one who knows more and more about less and less.” 
― Nicholas Murray, 
goodreads.com/author/quotes/
1657518.Nicholas_Murray_Butler

Steven Levy Math Resources

Hardware
  • AMD 3.8 GHz quad Rack, solid state drive, 1T and 3T drives
  • Bamboo Tablet
  • Audio-Technica digital microphone
  • Canon DSLR and camcorder
  • lighting and tripods
Software
  • Windows 8.1
  • MS Office
  • VideoScribe (animations)
  • Adobe Premiere Elements (editing)
  • Audacity (audio)
  • Dragon Frame (stop motion)
  • Blogger for notes
Sites
  • Facebook
  • Twitter
  • Youtube
  • Teachertube (125k hits)
  • Vimeo
  • Linkedin
Content
  • Google Advanced image search
  • freesound.org (Foley)
  • ccMixter (Music)


How much will the wall cost?

Wednesday, March 8, 2017

Gulf of Maine Warming - Credits and Notes

Credits and Notes

Introduction Picture 
"This is the Gulf of Maine", "Here's Boston" draw arrow


=== Credit for Picture ===== By The original uploader was Canadaolympic989 at 
English Wikipedia [GFDL (http://www.gnu.org/
copyleft/fdl.html) or CC-BY-SA-3.0 (http://creativecommons.org/licenses/by-sa/3.0/)], via Wikimedia Commons
=========================

"Warming waters a major factor in Gulf of Maine cod collapse" by NOAA Research 
http://research.noaa.gov/News/NewsArchive/LatestNews/TabId/684/ArtMID/1768/ArticleID/11410/Warming-waters-a-major-factor-in-Gulf-of-Maine-cod-collapse.aspx


I wanted to do my own curve fitting. I took numbers off the graph manually. I put them in an Excel spread sheet.

Here is my linear trend line.

Now I tried a polynomial. I think it looks closer to the data.

For 1980 to 2010, it looks like 0.017C(0.03F) per year or 0.17C(0.3F) per 10 years.

For 2007 to 2013, it looks like 0.25C (.45F) per year, 2.5C (4.5F) per 10 years. That makes one of the fastest warming seas on earth.

The interesting issue, is that the rate seems the rate of increase has changed by 2.5C/.17C or a factor of 15. So that means the temperature is now rising 15 times faster that it has for 30 years.

It does not seem like much but it is the fastest warming part of the ocean. These small temperature changes are enough to cause fish to move farther north.

===============================
Additional reference not used in videoStudy Finds Gulf of Maine Warming Faster Than Thought
http://www.nrcm.org/news/study-finds-gulf-of-maine-warming-faster-than-thought/

conducted by National Oceanic and Atmospheric Administration 


Vincent Saba, a NOAA Fisheries scientist and lead author of the study. The Gulf of Maine is temperature is rising faster than 99.9 percent other oceans.


Featured Post

Environmental Governor Needed!